System profiling, Applications tracing and Trace analysis
This section provides information related with tools, methodologies and features present and supported in the current Lumex release, that allow to profile the performance and behaviour of the system and/or applications.
Simpleperf
Simpleperf is a native CPU profiling tool for Android, which can be used to profile both Android applications and native processes running on Android.
Detailed documentation about this tool can be found on link.
The Linux Kernel exposes several Performance Monitoring Unit (PMU) - CPU and non-CPU - events, as well as software and tracepoint events to user space via the perf_event_open system call, which is used by simpleperf to collect and process the event’s data.
The following subsections do present some simpleperf command examples that can be used to obtain useful information to troubleshoot and validate the development.
Detailed information on the available commands supported, and their usage can be obtained on link.
Note
Although not all, most of the following commands do require root privileges in order to retrieve some of the system wide information.
Failing to do so, will result in the following error message “System wide profiling needs root privilege”.
To obtain root privileges, simply run the command su 0 before running any of the following examples.
Simpleperf List
A list of the different supported events can be obtained by running the command simpleperf list.
An example of the output provided by the command is presented below for reference:
console:/ $ simpleperf list

List of hw-cache events:
  # More cache events are available in `simpleperf list raw`.
  branch-load-misses
  branch-loads
  dTLB-load-misses
  dTLB-loads
  iTLB-load-misses
  iTLB-loads
  L1-dcache-load-misses
  L1-dcache-loads
  L1-icache-load-misses
  L1-icache-loads
  LLC-load-misses
  LLC-loads

List of coresight etm events:
  cs_etm/autofdo/
  cs-etm            # CoreSight ETM instruction tracing

List of hardware events:
  branch-instructions
  branch-misses
  bus-cycles
  cache-misses
  cache-references
  cpu-cycles
  instructions
  stalled-cycles-backend
  stalled-cycles-frontend

List of pmu events:
  arm_cspmu_0/cycles/
  arm_cspmu_1/cycles/
  arm_cspmu_2/cycles/
  arm_cspmu_3/cycles/
  arm_cspmu_4/cycles/
  arm_cspmu_5/cycles/
  arm_cspmu_6/cycles/
  arm_cspmu_7/cycles/
  arm_dsu_0/bus_access/
  arm_dsu_0/bus_cycles/
  arm_dsu_0/cycles/
  arm_dsu_0/memory_error/
  armv9_c1_nano/br_immed_retired/
  armv9_c1_nano/br_mis_pred/
  armv9_c1_nano/br_retired/
  armv9_c1_nano/br_return_retired/
  armv9_c1_nano/bus_access/
  (...)
  armv9_c1_pro/br_immed_retired/
  armv9_c1_pro/br_mis_pred/
  armv9_c1_pro/br_retired/
  armv9_c1_pro/br_return_retired/
  armv9_c1_pro/bus_access/
  armv9_c1_pro/bus_cycles/
  (...)
  armv9_c1_ultra/br_immed_retired/
  armv9_c1_ultra/br_mis_pred/
  armv9_c1_ultra/br_mis_pred_retired/
  armv9_c1_ultra/br_pred/
  armv9_c1_ultra/br_retired/
  armv9_c1_ultra/br_return_retired/
  armv9_c1_ultra/bus_access/
  armv9_c1_ultra/bus_cycles/
  (...)
  armv9_c1_ultra/trcextout2/
  armv9_c1_ultra/trcextout3/
  armv9_c1_ultra/ttbr_write_retired/
  cs_etm/autofdo/
List of raw events provided by cpu pmu:
  # Please refer to "PMU common architectural and microarchitectural event numbers"
  # and "ARM recommendations for IMPLEMENTATION DEFINED event numbers" listed in
  # ARMv9 manual for details.
  # A possible link is https://developer.arm.com/documentation/ddi0487.
  raw-ase-fp-addsub-spec (may supported on cpu 0-7)         # Floating-point operation speculatively executed, Advanced SIMD add or subtract
  raw-ase-fp-cvt-spec (may supported on cpu 0-7)            # Floating-point operation speculatively executed, Advanced SIMD convert
  raw-ase-fp-div-spec (may supported on cpu 0-7)            # Floating-point operation speculatively executed, Advanced SIMD divide
  raw-ase-fp-dot-spec (may supported on cpu 0-7)            # Floating-point operation speculatively executed, Advanced SIMD dot-product
  (...)
  raw-uop-retired (may supported on cpu 0-7)                # Micro-operation architecturally executed
  raw-uop-spec (may supported on cpu 0-7)           # Microarchitectural operation speculatively executed
  raw-vfp-spec (may supported on cpu 0-7)           # Operation speculatively executed, scalar floating-point

List of software events:
  alignment-faults
  context-switches
  cpu-clock
  cpu-migrations
  emulation-faults
  major-faults
  minor-faults
  page-faults
  task-clock
  (...)

List of tracepoint events:
  alarmtimer:alarmtimer_cancel
  alarmtimer:alarmtimer_fired
  alarmtimer:alarmtimer_start
  alarmtimer:alarmtimer_suspend
  asoc:snd_soc_bias_level_done
  asoc:snd_soc_bias_level_start
  asoc:snd_soc_dapm_connected
  (...)
  xhci-hcd:xhci_urb_dequeue
  xhci-hcd:xhci_urb_enqueue
  xhci-hcd:xhci_urb_giveback
Simpleperf Stat
The stat command can be used to get event counter values of the profiled processes.
The command can be customised to filter which events to use, which processes/threads to monitor, how to monitor and what print interval to adopt.
Some command examples are presented below.
Get system wide event counts for a specific duration and print at a specific interval
The following command allows to get the system wide default event counts, considering a duration of 1s and printing counts every 50ms:
console:/ # simpleperf stat -a --duration 1 --interval 0.05

Performance counter statistics:

#         count  event_name                # count / runtime
      1,483,234  cpu-cycles                # 0.077020 GHz
              0  stalled-cycles-frontend   # 0.000 /sec
              0  stalled-cycles-backend    # 0.000 /sec
      1,297,390  instructions              # 1.143245 cycles per instruction
        192,137  branch-instructions       # 10.411 M/sec
              0  branch-misses             # 0.000000% miss rate
  17.551168(ms)  task-clock                # 16.392911 cpus used
              2  context-switches          # 119.125 /sec
             14  page-faults               # 870.827 /sec

Total test time: 0.001071 seconds.
Performance counter statistics:

#         count  event_name                # count / runtime
      2,289,588  cpu-cycles                # 0.067113 GHz
              0  stalled-cycles-frontend   # 0.000 /sec
              0  stalled-cycles-backend    # 0.000 /sec
      2,087,677  instructions              # 1.096716 cycles per instruction
        334,399  branch-instructions       # 10.137 M/sec
              0  branch-misses             # 0.000000% miss rate
  32.023176(ms)  task-clock                # 10.628477 cpus used
              4  context-switches          # 127.891 /sec
             15  page-faults               # 490.151 /sec

Total test time: 0.003013 seconds.
(...)
Get event counts for a specific process within a duration
The following command allows to get the default event counts for the process system_server considering a duration of 50ms:
console:/ # ps -A | grep system_server
system         477   318   19313020 338596 do_epoll_wait       0 S system_server
console:/ #
console:/ # simpleperf stat -p 477 --duration 0.05

Performance counter statistics:

#        count  event_name                # count / runtime
             0  cpu-cycles                #
             0  stalled-cycles-frontend   #
             0  stalled-cycles-backend    #
             0  instructions              #
             0  branch-instructions       #
             0  branch-misses             #
  0.000000(ms)  task-clock                # 0.000000 cpus used
             0  context-switches          #
             0  page-faults               #

Total test time: 0.050069 seconds.
console:/sdcard #
Get specific events for a particular process
# this example assumes the previous "system_server" process with PID 477
console:/ # simpleperf stat -e cpu-cycles -p 477 --duration 0.05
Performance counter statistics:

#     count  event_name   # count / runtime
  6,351,580  cpu-cycles   # 0.099210 GHz

Total test time: 0.050210 seconds.
console:/sdcard #

# Additional examples:
console:/ # simpleperf stat -e cache-references,cache-misses -p 477 --duration 0.05
console:/ # simpleperf stat -e cache-references,cache-misses ls
Similarly to filtering events for a particular process using -p <PID> option, filtering events for specific threads can be achieved by using -t <TID> argument.
Get non-CPU PMU events
console:/ # simpleperf stat -a -e arm_dsu_0/cycles/ -- sleep 0.01
Performance counter statistics:

#                     count  event_name          # count / runtime
  9,223,372,036,854,775,809  arm_dsu_0/cycles/   # 433003296234.548 G/sec

Total test time: 0.021216 seconds.
console:/sdcard #
Note
Non-CPU PMU events are not supported in per-process due to perf or simpleperf not being able to attach events to a process.
Collect event counters using event-groups
console:/ # simpleperf stat --group cpu-cycles,instructions -- ls

acct         debug_ramdisk          lost+found   second_stage_resources
apex         dev                    mnt          storage
bin          etc                    odm          sys
bugreports   fstab.total_compute    odm_dlkm     system
cache        init                   oem          system_dlkm
config       init.common.rc         postinstall  system_ext
d            init.environ.rc        proc         vendor
data         init.total_compute.rc  product      vendor_dlkm
data_mirror  linkerconfig           sdcard
Performance counter statistics:

#      count  event_name     # count / runtime
  23,287,967  cpu-cycles     # 1.507257 GHz
  23,287,967  instructions   # 1.000000 cycles per instruction

Total test time: 0.018505 seconds.
console:/sdcard #
Simpleperf Record
The record command is used to dump samples of the profiled processes.
The following example provides a very basic usage scenario of the command:
console:/sdcard # pwd
/sdcard
console:/sdcard # simpleperf record ls
Alarms      DCIM       Movies         Pictures    Ringtones
Android     Documents  Music          Podcasts    TemporaryFile-t57Mnj
Audiobooks  Download   Notifications  Recordings  perf.data
simpleperf I cmd_record.cpp:798] Recorded for 0.0108992 seconds. Start post processing.
simpleperf I cmd_record.cpp:891] Samples recorded: 37. Samples lost: 0.
console:/sdcard #
Some additional command usage examples may include:
# Record individual process for a specific duration:
console:/ # simpleperf record -p <PID> --duration <DURATION IN SECONDS>

# Record set of processes for a specific duration:
console:/ # simpleperf record -p <PID1>,<PID2> --duration <DURATION IN SECONDS>

# Spawn workload as a child process and record it:
console:/ # simpleperf record <WORKLOAD APPLICATION>

# Frequency of the record can be set using -f or -c option, where
# '-f 1000' means collecting 1000 records every second, and
# '-c 1000' means collecting 1 record when 1000 events are hit.
console:/ # simpleperf record -f <FREQUENCY> -p <PID> --duration <DURATION IN SECONDS>
console:/ # simpleperf record -c <COUNT> -p <PID> --duration <DURATION IN SECONDS>
Simpleperf Report
The report command is used to report profiling data generated by the record command.
The following example assumes being executed following the previous simpleperf record ls command example:
# this example assumes and follows the run of the previous "simpleperf record ls" example
console:/sdcard # simpleperf report
Cmdline: /system/bin/simpleperf record ls
Arch: arm64
Event: cpu-cycles (type 0, config 0)
Samples: 34
Event count: 22952710

Overhead  Command  Pid   Tid   Shared Object                           Symbol
36.66%    ls       6446  6446  /system/lib64/libcrypto.so              sha256_block_data_order_nohw
7.96%     ls       6446  6446  /apex/com.android.runtime/bin/linker64  [linker]soinfo::lookup_version_info(VersionTracker const&, unsigned int, char const*, version_info const**)
7.23%     ls       6446  6446  [kernel.kallsyms]                       call_rcu
6.83%     ls       6446  6446  [kernel.kallsyms]                       el0_svc
5.46%     ls       6446  6446  [kernel.kallsyms]                       mas_destroy
5.10%     ls       6446  6446  /apex/com.android.runtime/bin/linker64  [linker]Config::read_binary_config(char const*, char const*, bool, bool, Config const**, std::__1::basic_string<char, std::__1::char_traits<char>, std::__1::allocator<char>>*)
5.08%     ls       6446  6446  /apex/com.android.runtime/bin/linker64  [linker]BionicSmallObjectAllocator::alloc()
4.76%     ls       6446  6446  [kernel.kallsyms]                       mas_empty_area_rev
4.55%     ls       6446  6446  /apex/com.android.runtime/bin/linker64  [linker]mprotect
4.38%     ls       6446  6446  [kernel.kallsyms]                       down_write
3.84%     ls       6446  6446  /apex/com.android.runtime/bin/linker64  [linker]bool plain_relocate_impl<(RelocMode)0>(Relocator&, elf64_rela*, unsigned long) (.__uniq.153370809355997480299804515629147722701)
3.30%     ls       6446  6446  [kernel.kallsyms]                       folio_remove_rmap_ptes
3.25%     ls       6446  6446  [kernel.kallsyms]                       mas_push_data
1.51%     ls       6446  6446  /apex/com.android.runtime/bin/linker64  [linker]page_size()
0.10%     ls       6446  6446  [kernel.kallsyms]                       __kasan_slab_alloc
0.01%     ls       6446  6446  [kernel.kallsyms]                       mas_wr_walk
0.00%     ls       6446  6446  [kernel.kallsyms]                       ___rmqueue_pcplist
0.00%     ls       6446  6446  [kernel.kallsyms]                       __kasan_unpoison_pages
0.00%     ls       6446  6446  [kernel.kallsyms]                       _get_random_bytes.llvm.8911717040554631468
0.00%     ls       6446  6446  [kernel.kallsyms]                       flush_signal_handlers
0.00%     ls       6446  6446  [kernel.kallsyms]                       update_sctlr_el1
console:/sdcard #
Perf
Perf is a profiler tool for Linux based systems that abstracts CPU hardware differences in Linux performance measurements, while presenting a simple command-line interface.
More information on the tool can be found on link.
The Linux Kernel exposes several Performance Monitoring Unit (PMU) - CPU and non-CPU - events, as well as software and tracepoint events to user space via the perf_event_open system call, which is used by perf to collect and process the event’s data.
List of available events
A list of the different supported events can be obtained by running the command perf list.
An example of the output provided by the command is presented below for reference:
# perf list
List of pre-defined events (to be used in -e or -M):

  branch-instructions OR branches                    [Hardware event]
  branch-misses                                      [Hardware event]
  bus-cycles                                         [Hardware event]
  cache-misses                                       [Hardware event]
  cache-references                                   [Hardware event]
  cpu-cycles OR cycles                               [Hardware event]
  instructions                                       [Hardware event]
  stalled-cycles-backend OR idle-cycles-backend      [Hardware event]
  stalled-cycles-frontend OR idle-cycles-frontend    [Hardware event]
  alignment-faults                                   [Software event]
  bpf-output                                         [Software event]
  cgroup-switches                                    [Software event]
  context-switches OR cs                             [Software event]
  cpu-clock                                          [Software event]
  cpu-migrations OR migrations                       [Software event]
  dummy                                              [Software event]
  emulation-faults                                   [Software event]
  major-faults                                       [Software event]
  minor-faults                                       [Software event]
  page-faults OR faults                              [Software event]
  task-clock                                         [Software event]
  duration_time                                      [Tool event]
  user_time                                          [Tool event]
  system_time                                        [Tool event]

armv9_c1_pro:
  L1-dcache-loads OR armv9_c1_pro/L1-dcache-loads/
  L1-dcache-load-misses OR armv9_c1_pro/L1-dcache-load-misses/
  L1-icache-loads OR armv9_c1_pro/L1-icache-loads/
  L1-icache-load-misses OR armv9_c1_pro/L1-icache-load-misses/
  LLC-loads OR armv9_c1_pro/LLC-loads/
  LLC-load-misses OR armv9_c1_pro/LLC-load-misses/
  dTLB-loads OR armv9_c1_pro/dTLB-loads/
  dTLB-load-misses OR armv9_c1_pro/dTLB-load-misses/
  iTLB-loads OR armv9_c1_pro/iTLB-loads/
  iTLB-load-misses OR armv9_c1_pro/iTLB-load-misses/
  branch-load-misses OR armv9_c1_pro/branch-load-misses/

armv9_c1_nano:
  L1-dcache-loads OR armv9_c1_nano/L1-dcache-loads/
  L1-dcache-load-misses OR armv9_c1_nano/L1-dcache-load-misses/
  L1-icache-loads OR armv9_c1_nano/L1-icache-loads/
  L1-icache-load-misses OR armv9_c1_nano/L1-icache-load-misses/
  LLC-loads OR armv9_c1_nano/LLC-loads/
  LLC-load-misses OR armv9_c1_nano/LLC-load-misses/
  dTLB-loads OR armv9_c1_nano/dTLB-loads/
  dTLB-load-misses OR armv9_c1_nano/dTLB-load-misses/
  iTLB-loads OR armv9_c1_nano/iTLB-loads/
  iTLB-load-misses OR armv9_c1_nano/iTLB-load-misses/
  branch-load-misses OR armv9_c1_nano/branch-load-misses/

armv9_c1_nano:
  L1-dcache-loads OR armv9_c1_nano/L1-dcache-loads/
  L1-dcache-load-misses OR armv9_c1_nano/L1-dcache-load-misses/
  L1-icache-loads OR armv9_c1_nano/L1-icache-loads/
  L1-icache-load-misses OR armv9_c1_nano/L1-icache-load-misses/
  LLC-loads OR armv9_c1_nano/LLC-loads/
  LLC-load-misses OR armv9_c1_nano/LLC-load-misses/
  dTLB-loads OR armv9_c1_nano/dTLB-loads/
  dTLB-load-misses OR armv9_c1_nano/dTLB-load-misses/
  iTLB-loads OR armv9_c1_nano/iTLB-loads/
  iTLB-load-misses OR armv9_c1_nano/iTLB-load-misses/
  branch-loads OR armv9_c1_nano/branch-loads/
  branch-load-misses OR armv9_c1_nano/branch-load-misses/
  br_immed_retired OR armv9_c1_pro/br_immed_retired/  [Kernel PMU event]
  br_mis_pred OR armv9_c1_pro/br_mis_pred/            [Kernel PMU event]
  br_retired OR armv9_c1_pro/br_retired/              [Kernel PMU event]
  br_return_retired OR armv9_c1_pro/br_return_retired/[Kernel PMU event]
  (...)
  arm_cspmu_0/cycles/                                [Kernel PMU event]
  arm_cspmu_1/cycles/                                [Kernel PMU event]
  arm_cspmu_2/cycles/                                [Kernel PMU event]
  arm_cspmu_3/cycles/                                [Kernel PMU event]
  arm_cspmu_4/cycles/                                [Kernel PMU event]
  arm_cspmu_5/cycles/                                [Kernel PMU event]
  arm_cspmu_6/cycles/                                [Kernel PMU event]
  arm_cspmu_7/cycles/                                [Kernel PMU event]
  arm_dsu_0/bus_access/                              [Kernel PMU event]
  arm_dsu_0/bus_cycles/                              [Kernel PMU event]
  arm_dsu_0/cycles/                                  [Kernel PMU event]
  arm_dsu_0/memory_error/                            [Kernel PMU event]
  arm_spe_0//                                        [Kernel PMU event]
  arm_spe_1//                                        [Kernel PMU event]
  cs_etm//                                           [Kernel PMU event]
  cs_etm/autofdo/                                    [Kernel PMU event]
  rNNN                                               [Raw hardware event descriptor]
  (...)
  mem:<addr>[/len][:access]                          [Hardware breakpoint]
  alarmtimer:alarmtimer_cancel                       [Tracepoint event]
  alarmtimer:alarmtimer_fired                        [Tracepoint event]
  alarmtimer:alarmtimer_start                        [Tracepoint event]
  alarmtimer:alarmtimer_suspend                      [Tracepoint event]
  (...)
  xhci-hcd:xhci_urb_dequeue                          [Tracepoint event]
  xhci-hcd:xhci_urb_enqueue                          [Tracepoint event]
  xhci-hcd:xhci_urb_giveback                         [Tracepoint event]
Note
The previous command may present its output in an unformatted way when running on the FVP. It may be desirable to instead redirect its output to a file and then list the contents of that file by running the following command sequence:
# perf list > perf_list.txt
# cat perf_list.txt
Perf Stat
The stat command can be used to get event counter values of the profiled processes. Some examples of its usage are presented following, as well as some considerations to take into account when considering Lumex-1, with direct implications on the perf stat command.
Special considerations considering Lumex-1 and implications on the perf stat command
Lumex-1 defines per-microarchitecture PMU instances. As a result, the Kernel CPU PMU events will be displayed for each CPU micro-architecture during perf list, as illustrated on the following excerpt:
(...)
  cpu_cycles OR armv9_c1_pro/cpu_cycles/              [Kernel PMU event]
  cpu_cycles OR armv9_c1_nano/cpu_cycles/              [Kernel PMU event]
  cpu_cycles OR armv9_c1_nano/cpu_cycles/             [Kernel PMU event]
(...)
When considering Kernel 6.1 and for situations where the perf command is executed as a task-bound (cpu==-1), the event is opened on an arbitrary CPU PMU and will only count on a subset of CPUs. This means, for example, that it might open on a “big” PMU and only count while the task is running on “big” CPUs, but not while the task is running on “little” CPUs.
The following excerpt illustrates one such situation, where cycles are not counted for the command ls, as the command did execute on the CPUs whose PMU were not selected by perf to open the events:
# perf stat -e cycles -- ls
arm-ffa-tee.ko
build_env.cfg

 Performance counter stats for 'ls':

     <not counted>      cycles                                                        (0.00%)

       0.000509460 seconds time elapsed

       0.000044000 seconds user
       0.000000000 seconds sys
#
To overcome this implication and always ensure the retrieval of meaningful data, perf commands should be executed in one of two possible ways:
providing to the
perfcommand the individual CPU PMU events to count:# perf stat -e armv9_c1_nano/cpu_cycles/,armv9_c!_pro/cpu_cycles/,armv9_c1_ultra/cpu_cycles/ -- ls arm-ffa-tee.ko build_env.cfg Performance counter stats for 'ls': <not counted> armv9_c1_pro/cycles/ (0.00%) <not counted> armv9_c1_nano/cycles/ (0.00%) 1573935 armv9_c1_nano/cycles/ 0.000853528 seconds time elapsed 0.000983000 seconds user 0.000000000 seconds sys #providing to the
perfcommand a CPU mask so that the event is opened on all CPU PMUs:# perf stat -C 0-7 -e instructions,cycles -- ls arm-ffa-tee.ko build_env.cfg WARNING: A requested CPU in '0-7' is not supported by PMU 'armv9_c1_pro' (CPUs 2-5) for event 'instructions' WARNING: A requested CPU in '0-7' is not supported by PMU 'armv9_c1_nano' (CPUs 0-1) for event 'instructions' WARNING: A requested CPU in '0-7' is not supported by PMU 'armv9_c1_nano' (CPUs 6-7) for event 'instructions' WARNING: A requested CPU in '0-7' is not supported by PMU 'armv9_c1_pro' (CPUs 2-5) for event 'cycles' WARNING: A requested CPU in '0-7' is not supported by PMU 'armv9_c1_nano' (CPUs 0-1) for event 'cycles' WARNING: A requested CPU in '0-7' is not supported by PMU 'armv9_c1_nano' (CPUs 6-7) for event 'cycles' Performance counter stats for 'CPU(s) 0-7': 154412 armv9_c1_pro/instructions/ # 1.01 insn per cycle 57256 armv9_c1_nano/instructions/ # 1.01 insn per cycle 1969132 armv9_c1_nano/instructions/ # 1.00 insn per cycle 153600 armv9_c1_pro/cycles/ 56742 armv9_c1_nano/cycles/ 1968510 armv9_c1_nano/cycles/ 0.001367792 seconds time elapsed #
As can also be seen on the previous example, the instructions are not broken down to specific PMU type (CPU type). This might be ambiguous for users to read the result, as instructions/cycles on different CPUs do have different performance meaning.
This issue seems to have been fixed in newer Kernel versions (>=6.6) and when running the perf command with the default event names (without providing the CPU mask). Therefore, a possible solution could be to compile perf from newer source code, and copy the resulting binary into the rootfs before booting the image, or alternatively use the scp command to upload the binary to a booted system.
Additional perf stat command examples are illustrated following, where the -C 0-7 argument was used as a workaround for the above-mentioned issue (Lumex-1 FVP has 8 CPUs):
## Single event
# perf stat -C 0-7 -e <EVENT> -- <WORKLOAD>

## Multiple events
# perf stat -C 0-7 -e <EVENT1>,<EVENT2>,...,<EVENT-N> -- <WORKLOAD>

## Event grouping
# perf stat -C 0-7 -e '{<EVENT1>,<EVENT2>,...,<EVENT-N>}' -- <WORKLOAD>

## Attaching to the existing process; 'sleep X' is passed to run perf for a specific duration
# perf stat -C 0-7 -e <EVENT> -p <PID> -- sleep 1
Note
DSU and MCN PMU driver do not support all possible events by name. For cases where data for a particular event is not visible, perf stat can be used with a raw event ID.
Some examples of how to read the non-CPU PMU event counters are presented below (the values 0xa2 and 0x182 are obtained from the respective component TRM documentation):
# perf stat -e arm_dsu_0/cycles/,arm_dsu_0/memory_error/ -- sleep 0.01

  Performance counter stats for 'system wide':

    <not supported>      arm_dsu_0/cycles/
                  0      arm_dsu_0/memory_error/

        0.010840960 seconds time elapsed
#

## Additional examples:
## Count DSU cache read refills
# perf stat -e arm_dsu_0/event=0xa2/ -- sleep 0.01
Perf Record, Report and Annotate
Running perf record will collect and generate a perf.data file containing the sampling data of one or more events.
This data can be later analysed using perf report or perf annotate commands.
By default, the perf record uses cycles as a default event.
To modify the sampling period while running perf record, two approaches can be followed:
frequency: specifies the average rate of samples/sec (
-Foption);count: enforces sampling at the specifies event period (
-coption).
Some command examples illustrating this usage are presented below:
# Sample on event cycles at the default frequency
perf record -C 0-7 <WORKLOAD>

# Sample on event instructions at 1000 samples/sec
perf record -C 0-7 -e instructions -F 1000 <WORKLOAD>

# Sample on event instructions at every 2000 occurrences of event
perf record -C 0-7 -e instructions -c 2000 <WORKLOAD>
Perf and Arm SPE extension
The Arm Statistical Profiling Extension (SPE) feature provides a hardware assisted CPU operation profiling mechanism. This provides accurate attribution of latencies and events down to individual instructions.
The general perf record command usage with SPE on the Lumex-1 platform looks like:
perf record -e arm_spe_<spe_instance>/<CONFIG PARAMETERS>/ -- taskset -c <cpu_list> <WORKLOAD>
Lumex-1 supports SPE only on Mid and Big CPUs and not on small CPUs, there are 2 SPE instances, arm_spe_0 for Mid CPUs (CPUs 2-5) and arm_spe_1 for big CPUs (CPUs 6-7).
When workload needs to be analyzed using SPE, it should be bound to CPUs which have the SPE capability using taskset.
So on the Lumex-1 platform, workloads should be bound to CPUs 2-5 when using arm_spe_0 and workloads should be bound to CPUs 6-7 when using arm_spe_1.
min_latency=0 config parameter is mandatory to provide with any perf-spe command.
The following listing illustrates how to record SPE samples on Mid CPUs with arm_spe_0:
# perf record -e arm_spe_0/min_latency=0/ -- taskset -c 2-5 ls
arm-tstee.ko   build_env.cfg  perf.data
[ perf record: Woken up 1 times to write data ]
[ perf record: Captured and wrote 0.124 MB perf.data ]
#
The previously recorded data (perf.data) can then be analyzed using the perf report command as follows:
# perf report
  Warning:
  Please install libunwind or libdw development packages during the perf build.
  Only instruction-based sampling period is currently supported by Arm SPE.
  # To display the perf.data header info, please use --header/--header-only options.
  #
  #
  # Total Lost Samples: 0
  #
  # Samples: 601  of event 'l1d-access'
  # Event count (approx.): 601
  #
  # Children      Self  Command  Shared Object          Symbol
  # ........  ........  .......  .....................  ....................................................
  #
    3.16%     3.16%  ls       [kernel.kallsyms]      [k] unmap_page_range
    2.33%     2.33%  ls       [kernel.kallsyms]      [k] next_uptodate_folio
    2.00%     2.00%  ls       [kernel.kallsyms]      [k] filemap_map_pages
    1.83%     1.83%  ls       [kernel.kallsyms]      [k] set_pte_range
    1.83%     1.83%  taskset  [kernel.kallsyms]      [k] unmap_page_range
    1.66%     1.66%  ls       [kernel.kallsyms]      [k] folio_add_file_rmap_ptes
    1.33%     1.33%  ls       [kernel.kallsyms]      [k] bsearch
   (...)
The previous example only specify min_latency=0 required config parameter. However, there can be situations where making usage of the other config parameters may help to filter profiling information.
Complementing the previous example, let’s assume it would be desirable to make usage of the config parameter event_filter=2, which discards all samples which do not have retired instructions events.
The following command listing illustrates the command usage considering this scenario:
# perf record -e arm_spe_0/min_latency=0,event_filter=2/ -- taskset -c 2 ls
arm-tstee.ko   build_env.cfg  perf.data
[ perf record: Woken up 1 times to write data ]
[ perf record: Captured and wrote 0.124 MB perf.data ]
#
Detailed information regarding the config parameters can be found at link.
Kernel config and prerequisites for enabling Arm SPE can also be found in the Kernel documentation.
Perfetto
Perfetto is an open-source stack developed for performance instrumentation and trace analysis. It offers services and libraries for recording system-level and app-level traces, native and Java heap profiling, a library for analysing traces using SQL, and a web-based user interface (UI) that allows to visualize and explore the collected traces.
It has support for ftrace, atrace, /proc/{stat,vmstat,pid}/* and perf_event as data sources to collect system level traces. A data source can be seen as the capability, exposed by a producer, of providing some tracing data. The producer is an entity that offers the ability to contribute to the trace, advertising this ability with one or more data sources. A consumer is an entity that controls the tracing service, provides to the tracing service the trace configuration and reads back the trace buffers. The tracing service is a long-lived entity (i.e. a system daemon on Linux/Android) which handles the tracing sessions, routes trace configuration from consumer to producers, and manages trace buffers.
The data source defines its own schema (a protobuf) consisting of data source trace config (what kind of input config it would expect from the consumer) and trace packets (what kind of data it would output into the trace).
- Some examples of data sources advertised by different producers to collect system-level traces are listed below:
linux.process_stats
linux.ftrace
linux.sys_stats
linux.perf
Recording and Visualising Traces with Perfetto
Perfetto can record traces, using either the UI (available at https://ui.perfetto.dev/#!/record) or the command line. An example of how perfetto can be used to collect traces using the command line is present below:
# the following commands are intended to be run on the host PC;
# only applicable for the following command, the current path is assumed to be <TC_WORKSPACE>
export PATH="$(pwd)/src/android/out/host/linux-x86/bin:${PATH}"
adb connect localhost:<PORT>
adb devices
adb -s localhost:<PORT> push config.txt /data/local/tmp/config.txt
adb -s localhost:<PORT> shell perfetto -o /data/misc/perfetto-traces/trace_file.perfetto-trace --txt -c /data/local/tmp/config.txt
adb -s localhost:<PORT> pull /data/misc/perfetto-traces/trace_file.perfetto-trace ./
- Some complementing considerations regarding the previous presented command listing:
the use of
-s localhost:<PORT>can be ignored if there is only one ADB instance available for debug to the host;the default ADB port is 5555; however, in cases where there are more than one ADB instance available for debug to the host, the port may change; in these situations refer to the output of the
adb devicescommand or to the FVP-model start up log information to understand which port was assigned as replacement; the ADB connection on Android section provides additional information that can be useful to troubleshoot the connection;config.txtcontains the perfetto trace config; some examples of this config will be presented in the Trace config examples subsection.
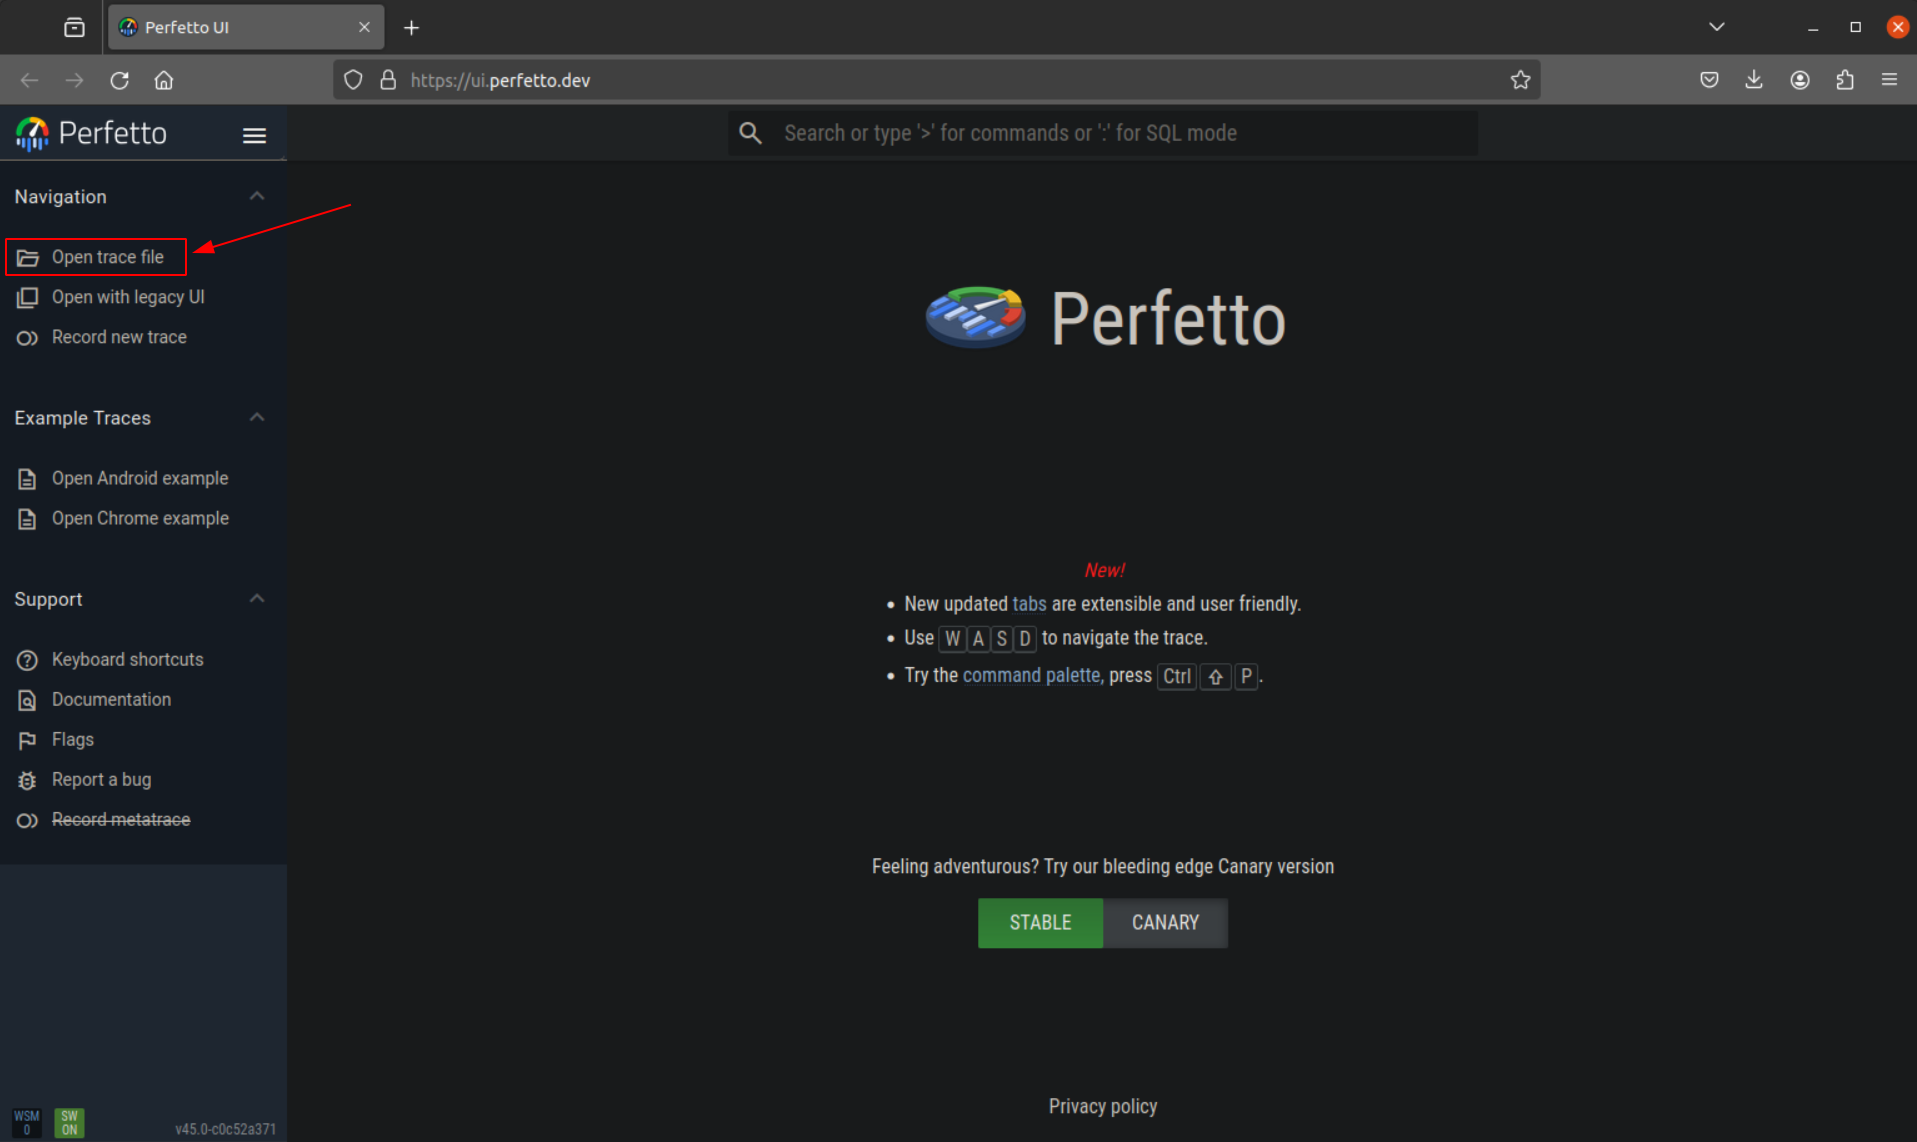
Once the perfetto trace file is collected and downloaded to the host, it can be loaded into the perfetto UI (available at https://ui.perfetto.dev/) using the option “open trace file”, as illustrated on the following image:
Detailed information regarding perfetto can be found on the official documentation available at https://perfetto.dev/docs/.
Trace config examples
This subsection provides three trace config examples that can be used to control the tracing service and influence the sampled data on the Lumex-1 platform. Alongside to each trace configuration, examples of the visualisation of the respective captured trace data using the Perfetto UI are also included for reference.
Additional examples of data source trace configurations for different supported data sources can be found at https://perfetto.dev/docs/ (please refer to the “Data sources” section). Some additional config examples can be found in test/configs/ directory in perfetto source code.
A full list of supported ftrace events can be found in file protos/perfetto/trace/ftrace/ftrace_event.proto in perfetto source code.
A full list of supported meminfo and vmstat counters can be found in file protos/perfetto/common/sys_stats_counters.proto in perfetto source code.
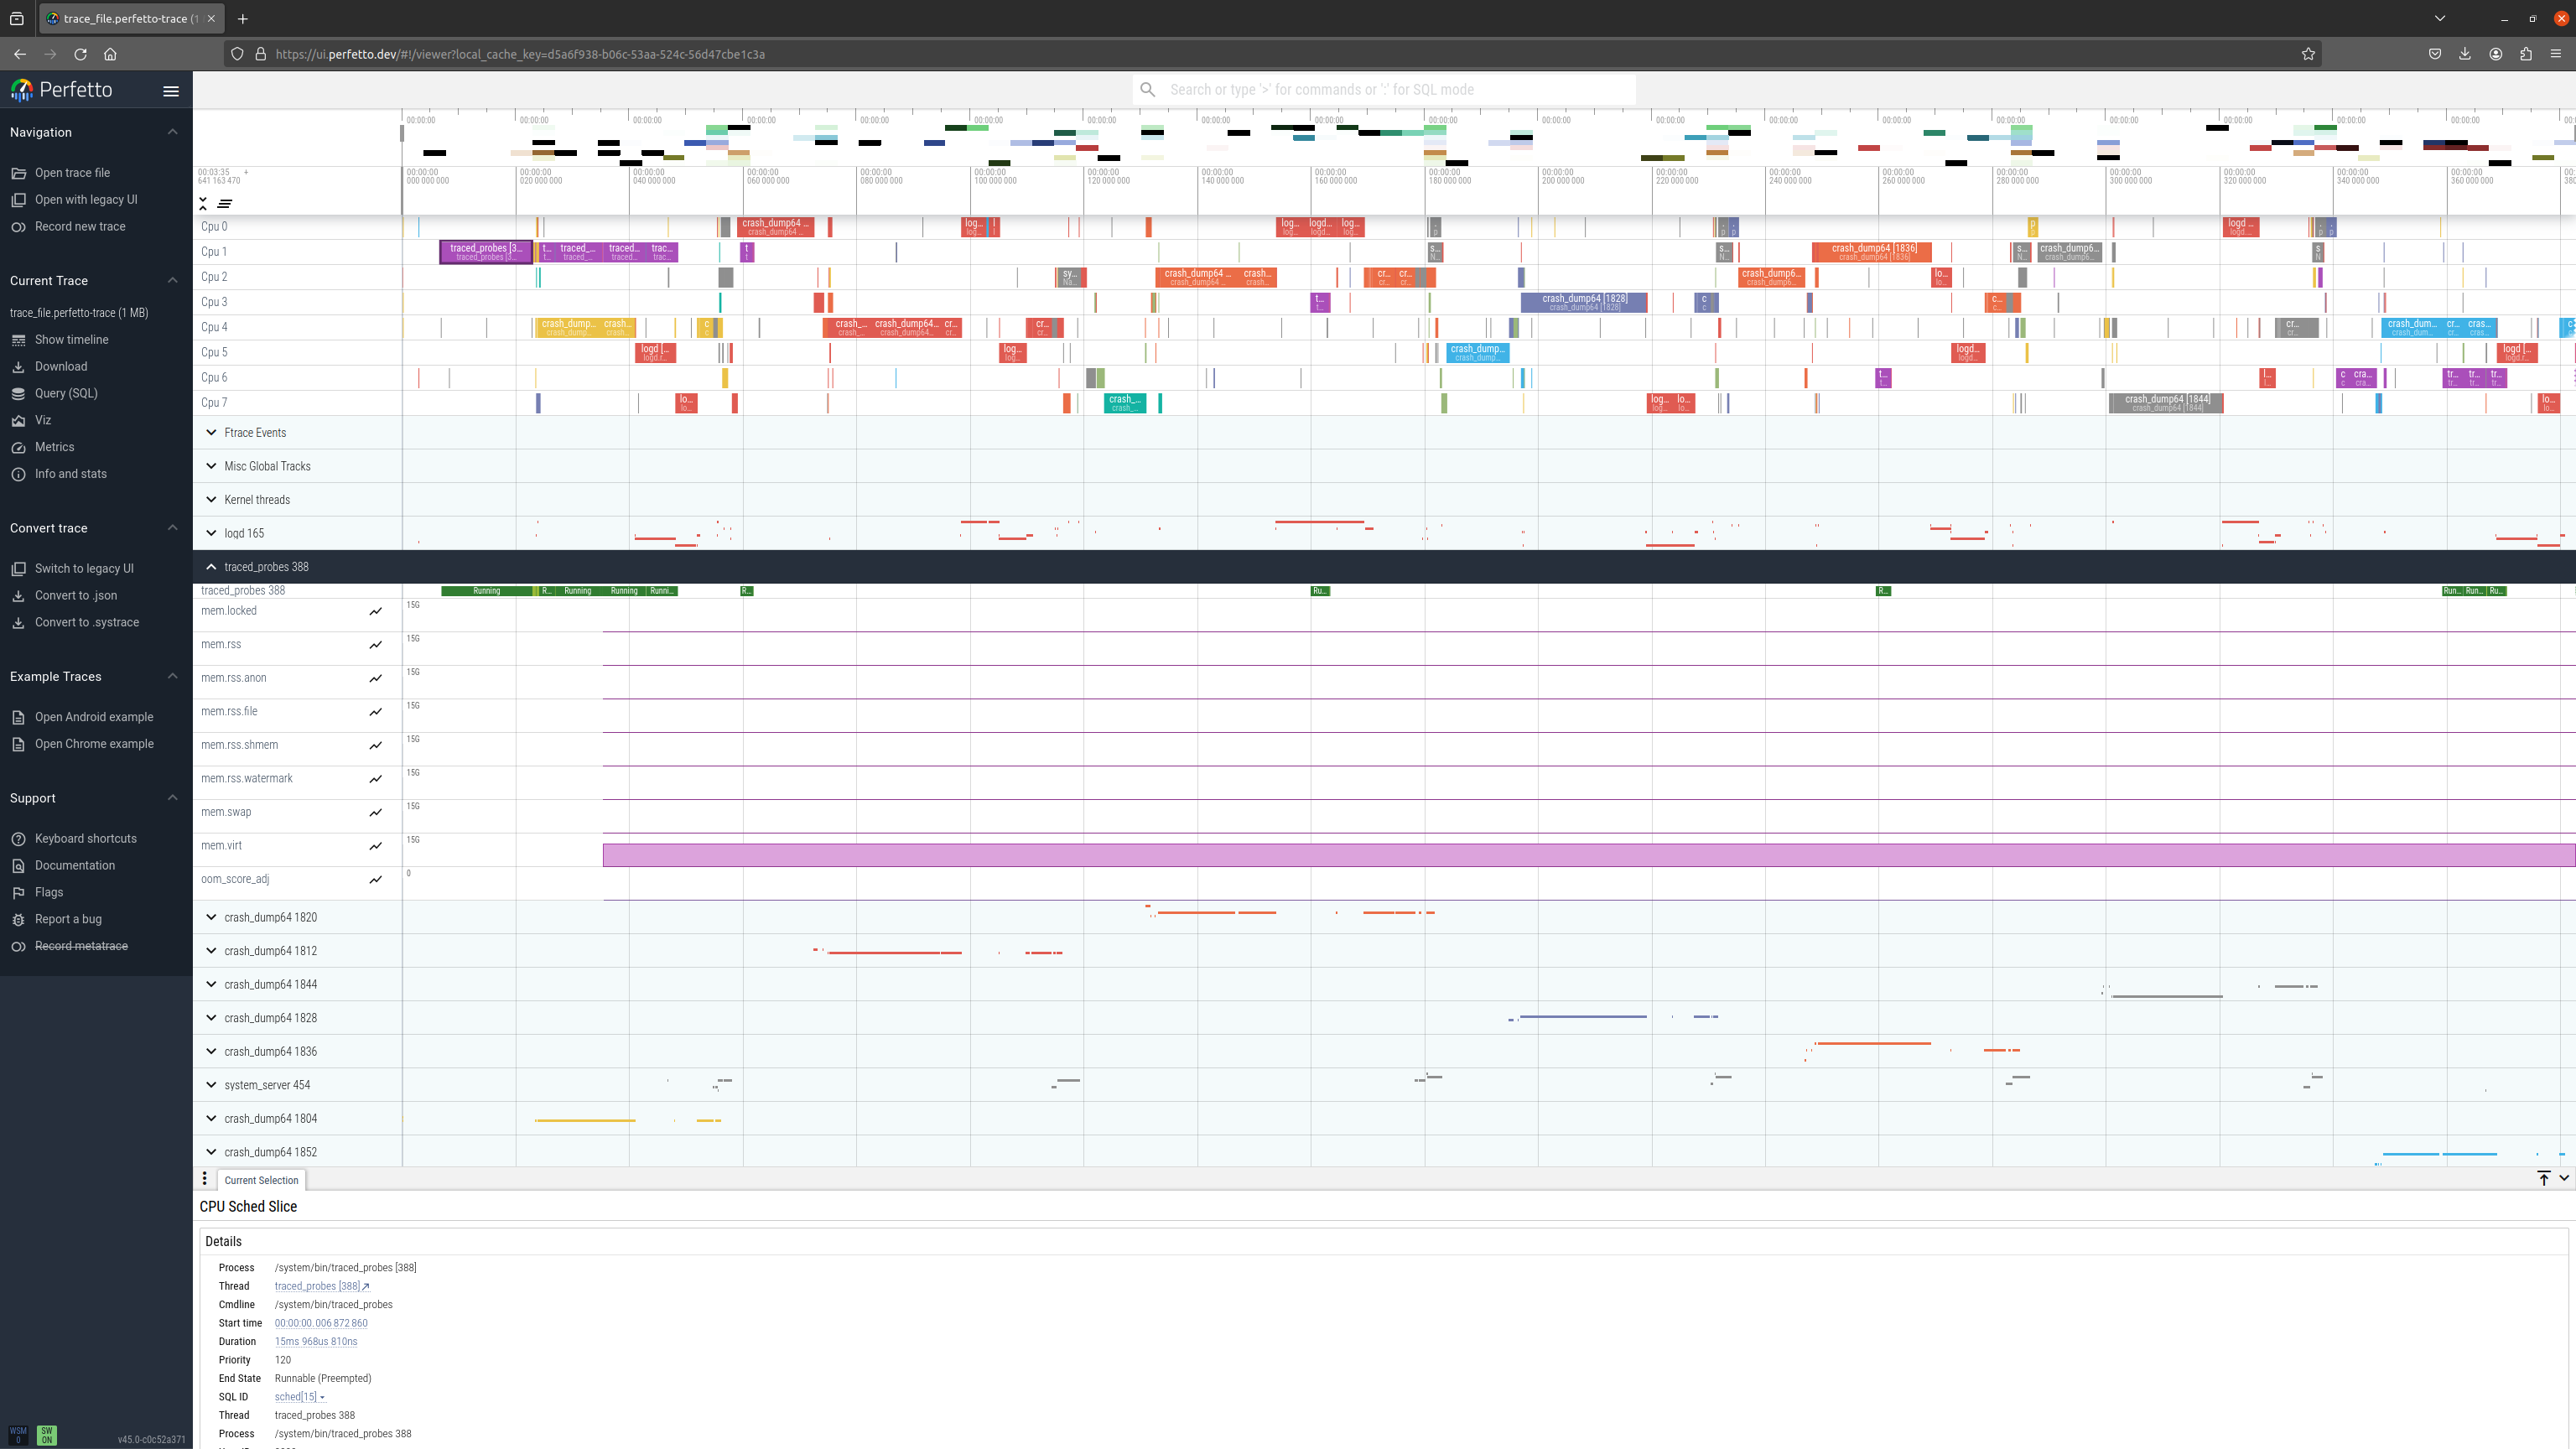
Example 1: collect ftrace scheduling events, process stats and system stats counters every 1000ms:
Trace configuration file:
buffers {
  size_kb: 16384
  fill_policy: RING_BUFFER
}

buffers {
  size_kb: 16384
  fill_policy: RING_BUFFER
}

data_sources {
  config {
    name: "linux.ftrace"
    target_buffer: 0
    ftrace_config {
      # Scheduling information and process tracking. Useful for:
      # - what is happening on each CPU at each moment
      # - why a thread was de-scheduled
      # - parent/child relationships between processes and threads.
      ftrace_events: "sched/sched_switch"
      ftrace_events: "power/suspend_resume"
      ftrace_events: "sched/sched_process_exit"
      ftrace_events: "sched/sched_process_free"
      ftrace_events: "task/task_newtask"
      ftrace_events: "task/task_rename"

      # Wakeup info. Allows to compute how long a task was
      # blocked due to CPU contention.
      ftrace_events: "sched/sched_wakeup"

      # os.Trace markers:
      ftrace_events: "ftrace/print"
      # RSS and ION buffer events:
      ftrace_events: "mm_event/mm_event_record"
      ftrace_events: "kmem/rss_stat"
      ftrace_events: "kmem/ion_heap_grow"
      ftrace_events: "kmem/ion_heap_shrink"
    }
  }
}

data_sources {
  config {
    name: "linux.sys_stats"
    target_buffer: 1
    sys_stats_config {
      meminfo_period_ms: 100
      meminfo_counters: MEMINFO_MEM_AVAILABLE
      meminfo_counters: MEMINFO_BUFFERS
      meminfo_counters: MEMINFO_CACHED
      meminfo_counters: MEMINFO_SWAP_CACHED
      meminfo_counters: MEMINFO_ACTIVE
      meminfo_counters: MEMINFO_INACTIVE
      meminfo_counters: MEMINFO_ACTIVE_ANON
      meminfo_counters: MEMINFO_INACTIVE_ANON
      meminfo_counters: MEMINFO_ACTIVE_FILE
      meminfo_counters: MEMINFO_INACTIVE_FILE
      meminfo_counters: MEMINFO_UNEVICTABLE

      vmstat_period_ms: 100
      vmstat_counters: VMSTAT_NR_FREE_PAGES
      vmstat_counters: VMSTAT_NR_ALLOC_BATCH
      vmstat_counters: VMSTAT_NR_INACTIVE_ANON
      vmstat_counters: VMSTAT_NR_VMSCAN_WRITE
      vmstat_counters: VMSTAT_NR_VMSCAN_IMMEDIATE_RECLAIM
      vmstat_counters: VMSTAT_NR_WRITEBACK_TEMP

      stat_period_ms: 100
      stat_counters: STAT_CPU_TIMES
      stat_counters: STAT_IRQ_COUNTS
      stat_counters: STAT_FORK_COUNT
    }
  }
}

data_sources: {
    config {
        name: "linux.process_stats"
        target_buffer: 0
        process_stats_config {
            scan_all_processes_on_start: true
            proc_stats_poll_ms: 1000
        }
    }
}

duration_ms: 1000
Perfetto UI visualisation:
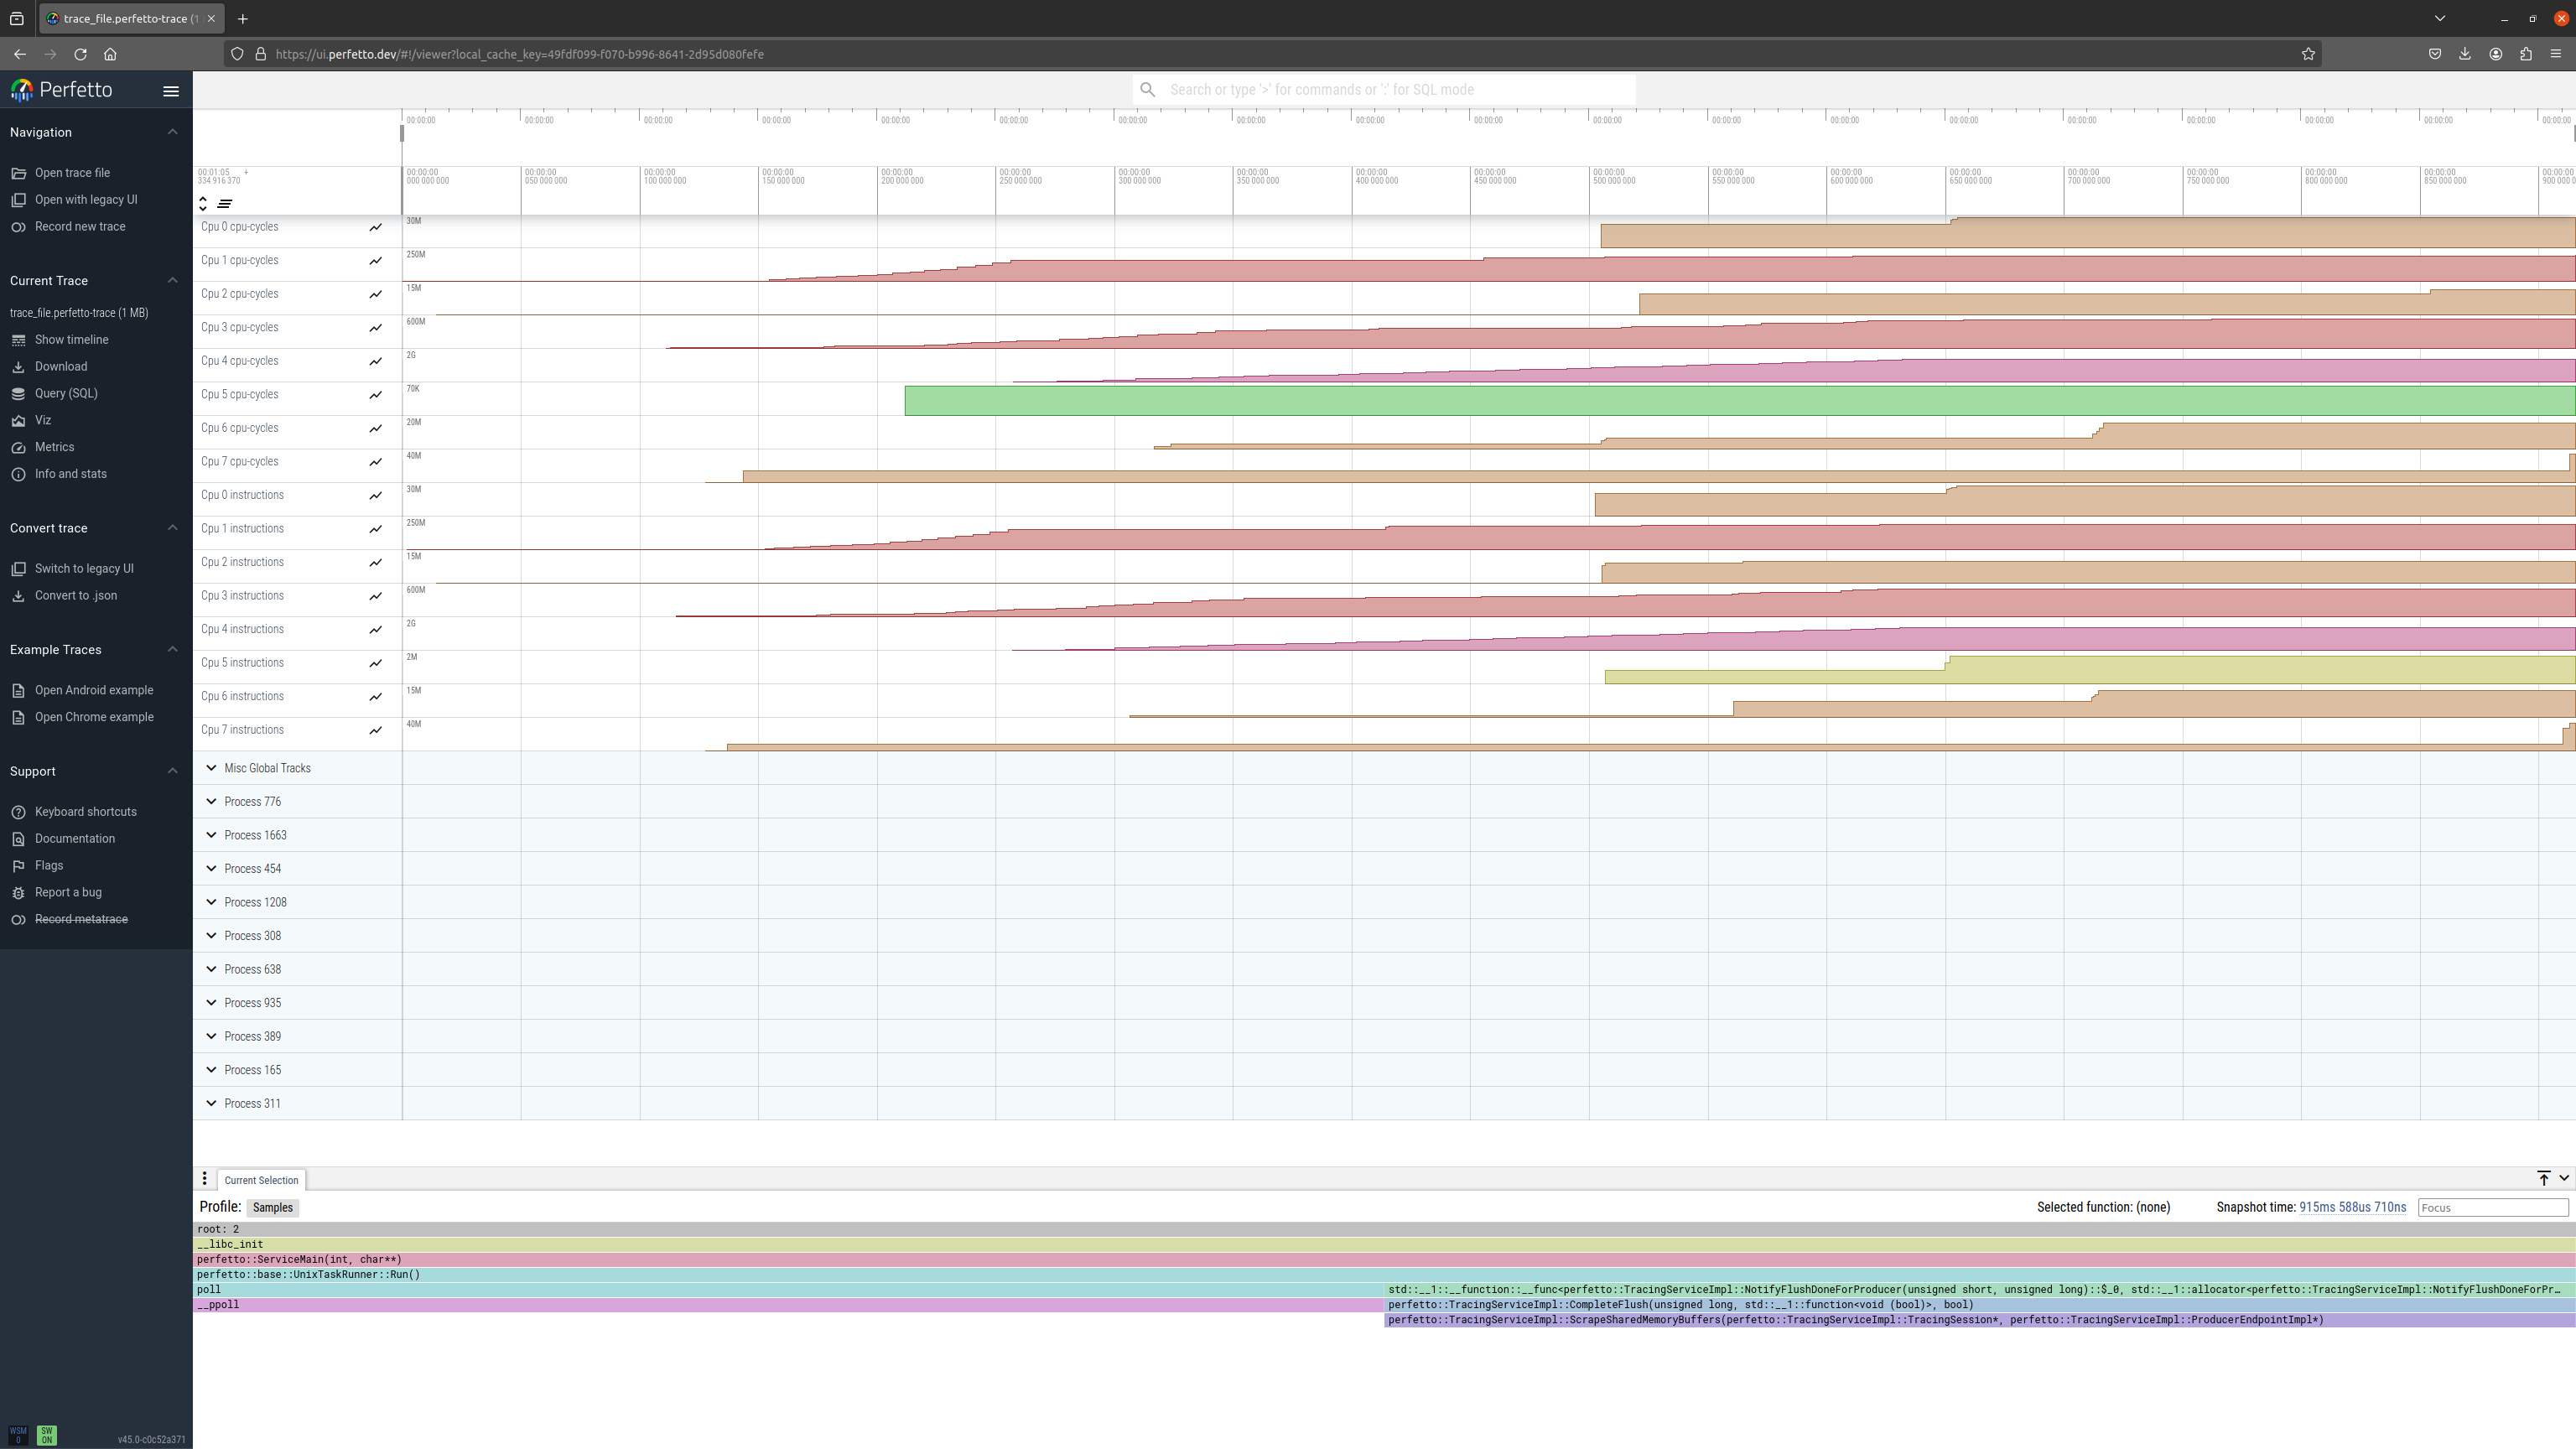
Example 2: collect cpu_cycles and instructions CPU PMU counters on all CPUs:
Trace configuration file:
buffers {
  size_kb: 10240
  fill_policy: RING_BUFFER
}

data_sources {
  config {
    name: "linux.perf"
    target_buffer: 0
    perf_event_config {
      all_cpus: true
      timebase {
        frequency: 99
        counter: HW_CPU_CYCLES
        timestamp_clock: PERF_CLOCK_MONOTONIC
      }
    }
  }
}

data_sources {
  config {
    name: "linux.perf"
    target_buffer: 0
    perf_event_config {
      all_cpus: true
      timebase {
        frequency: 99
        counter: HW_INSTRUCTIONS
        timestamp_clock: PERF_CLOCK_MONOTONIC
      }
    }
  }
}

duration_ms: 1000
Perfetto UI visualisation:
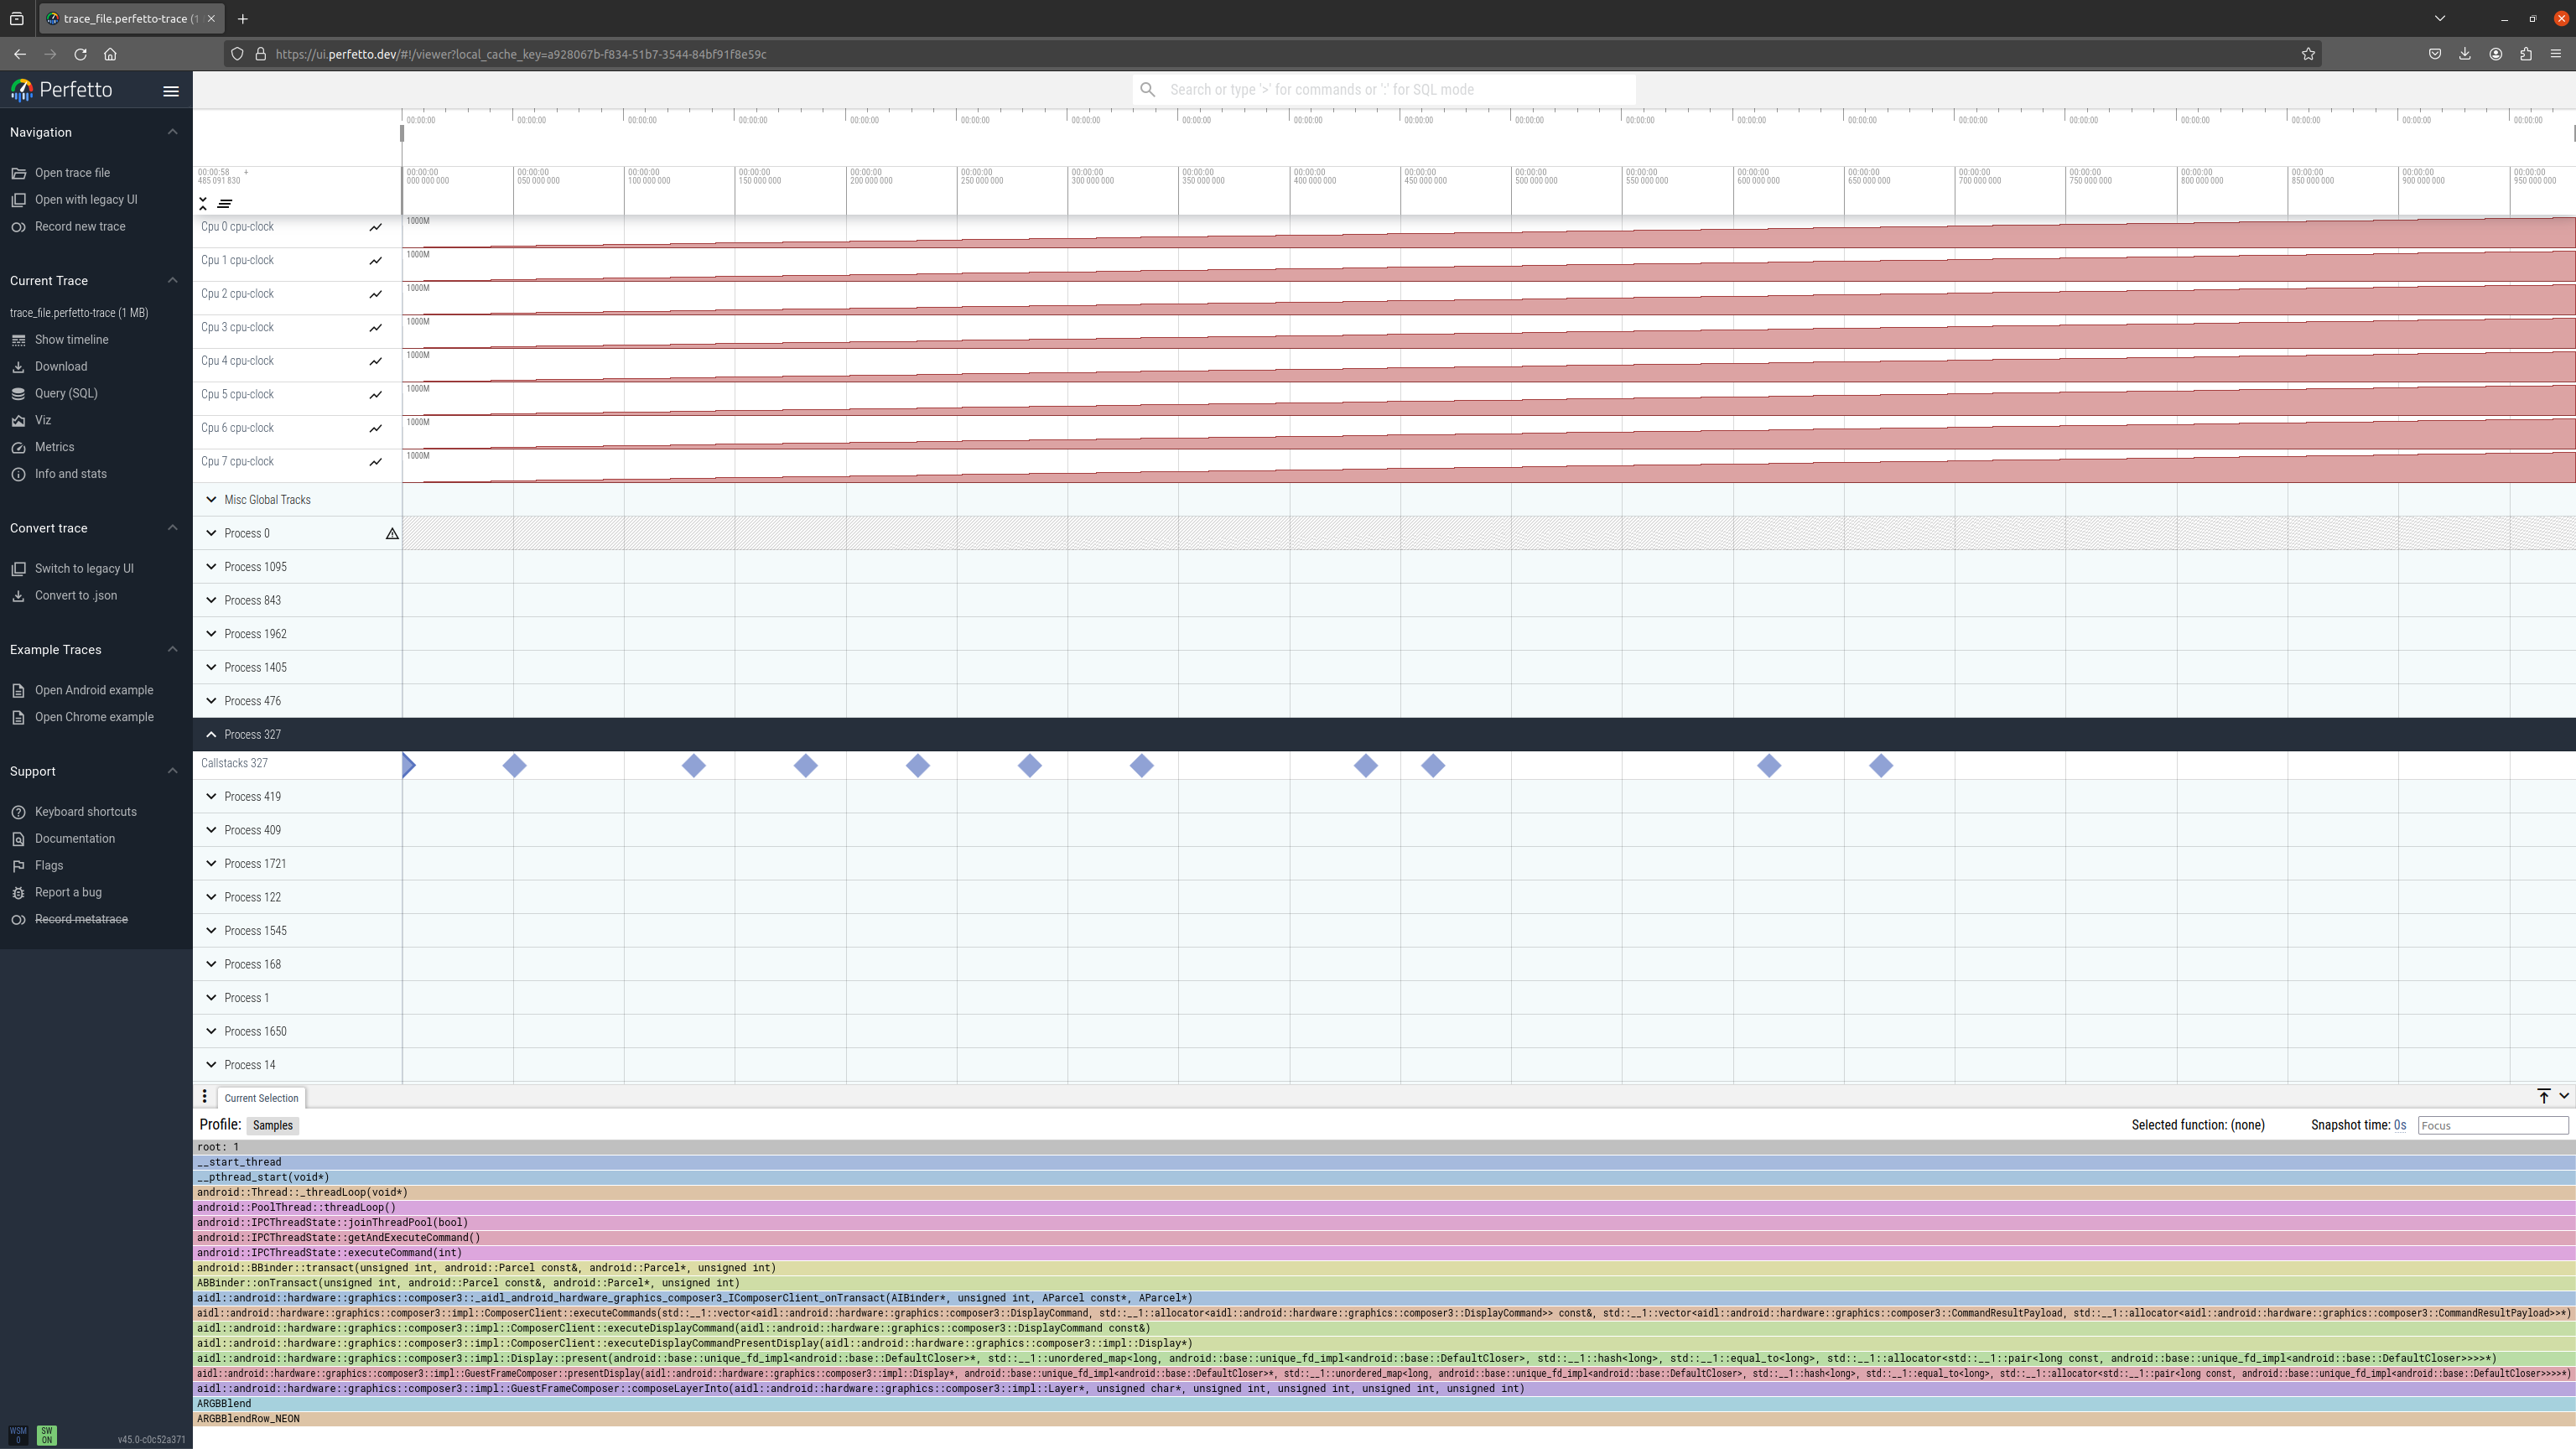
Example 3: call stack sampling of processes:
Trace configuration file:
buffers {
  size_kb: 10240
  fill_policy: RING_BUFFER
}

data_sources {
  config {
    name: "linux.perf"
    target_buffer: 0
    perf_event_config {
      timebase {
        frequency: 99
        timestamp_clock: PERF_CLOCK_MONOTONIC
      }
      callstack_sampling {
        kernel_frames: true
      }
    }
  }
}

duration_ms: 1000
Perfetto UI visualisation:
Copyright (c) 2022-2025, Arm Limited. All rights reserved.